Service Analytics is the reporting feature in BMC FootPrints. This reporting feature can be powerful with a little knowledge of formulas and filters. The best practice in creating a report in Service Analytics is to use a Saved Search that is created in the Advanced Search within BMC FootPrints.
This article will focus, on a high level, on three items. One: to get recognizable data from the calculated fields in a report. Calculated fields will natively show the hours and tenth of hours. A series of formulas will allow the report to show the data as dd:hh:mm:ss. Second: reporting on data from the previous month for Priority and Status using formulas. Third: reporting on sorted data for categories.
Prerequisites
- System role access for Service Analytics Permission.
- Tickets must exist.
AGE OF TICKET SOLUTION
When we create reports, we have that horrible “Age of Ticket” field which displays only the number of hours the ticket has been open.

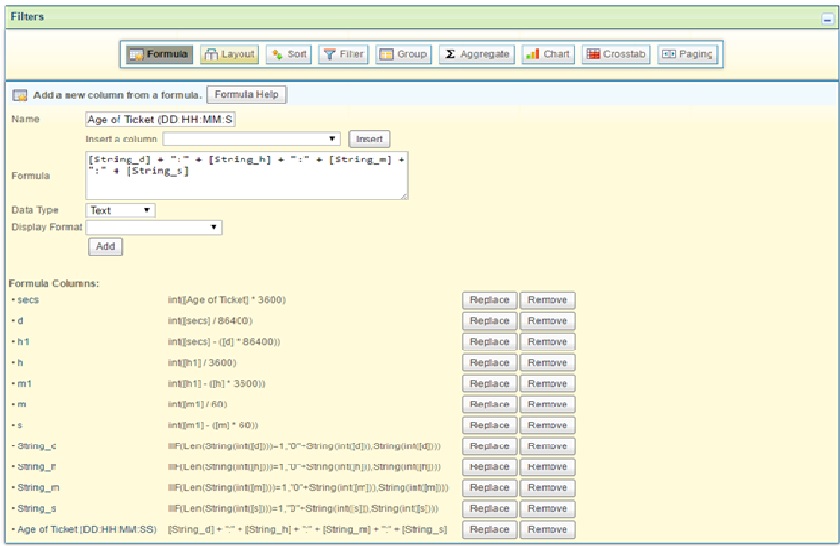
You need to create multiple formulas in the report in this order. The Formula area in Service Analytics only returns one value per formula, so these must be done separately. They must be done in this order for the later formulas to receive the calculations from the earlier formulas.
Also, for some reason you can’t just type in [h] for the name of the column. You MUST use the dropdown to insert the column name.
| secs | int([Age of Ticket] * 3600) | Number |
| d | int([secs] / 86400) | Number |
| h1 | int([secs] – ([d] * 86400)) | Number |
| h | int([h1] / 3600) | Number |
| m1 | int([h1] – ([h] * 3600)) | Number |
| m | int([m1] / 60) | Number |
| s | int([m1] – ([m] * 60)) | |
| String_d | IIF(Len(String(int([d])))=1,”0″+String(int([d])),String(int([d]))) | |
| String_h | IIF(Len(String(int([h])))=1,”0″+String(int([h])),String(int([h]))) | |
| String_m | IIF(Len(String(int([m])))=1,”0″+String(int([m])),String(int([m]))) | |
| String_s | IIF(Len(String(int([s])))=1,”0″+String(int([s])),String(int([s]))) |
Age of Ticket (DD:HH:MM:SS) [String_d] + “:” + [String_h] + “:” + [String_m] + “:” + [String_s] Text
Here’s how it will look when done:
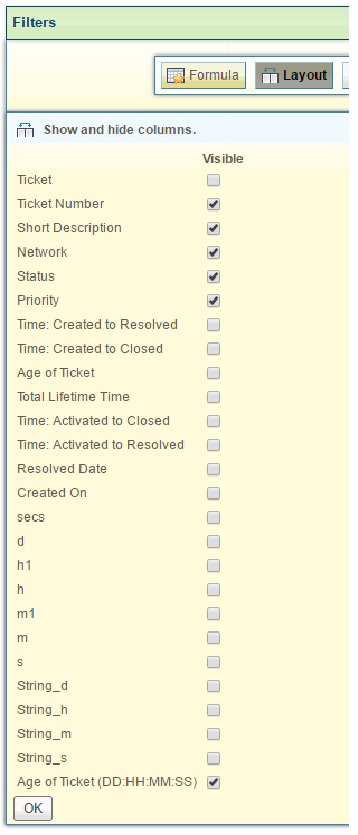
You can then hit the “Layout” button and remove all the formula fields from the report:
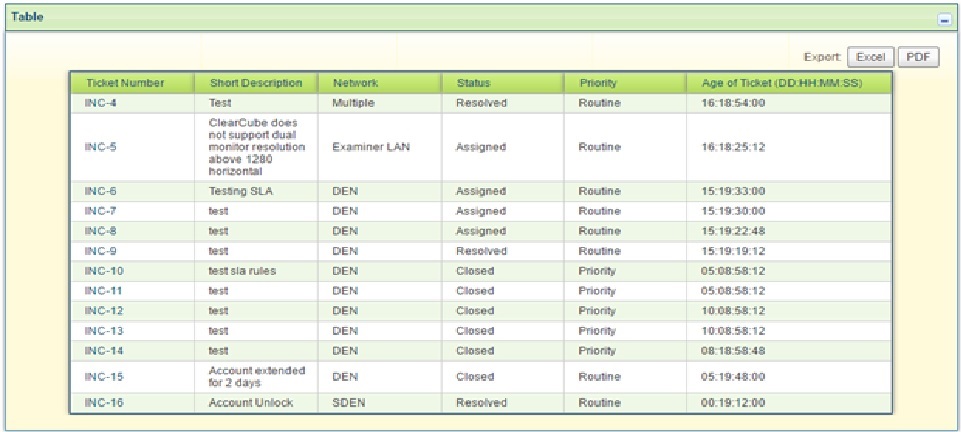
This is how the report will look after this is done:
DATA FOR PREVIOUS MONTH SOLUTION
Formulas can be used to find data for the previous month rather than an Advanced Search. There are three simple formulas to create and only two fields are used: Priority and Status.
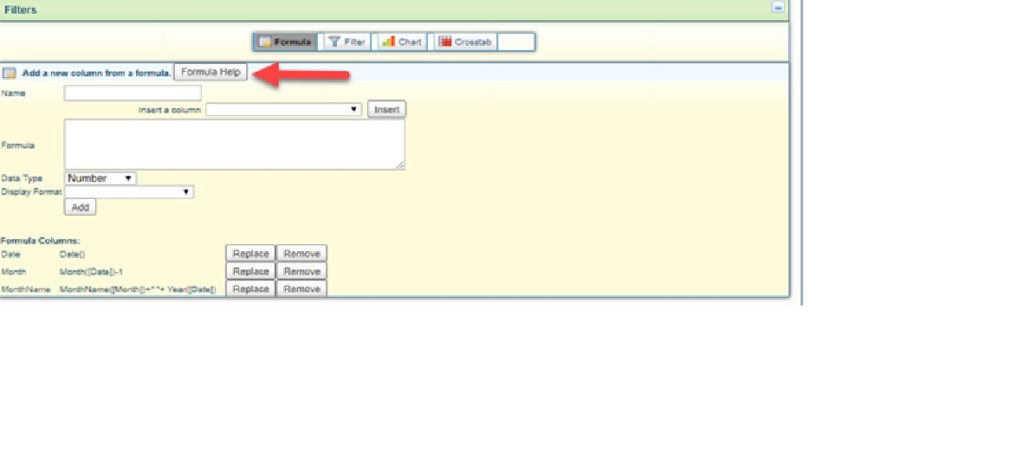
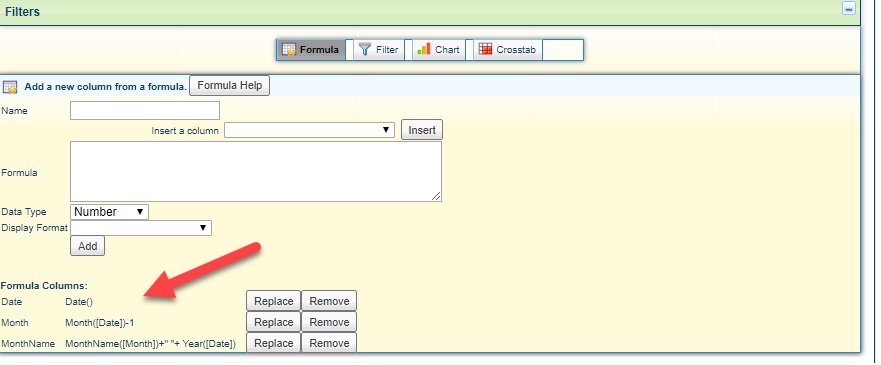
After the fields are selected in the Configurations section of the report; create three formulas. One to find the date, one to find the month number and one to find the name of the month number. These formulas used, and others, can be found by clicking on the Formula Help button in the Filters section.
You need to create multiple formulas in the report in this order. The Formula area in Service Analytics
only returns one value per formula, so these must be done separately. They must be done in this order
for the later formulas to receive the calculations from the earlier formulas.
Date Date() Text
Month Month([Date])-1 Text
MonthName MonthName([Month])+” “+ Year([Date]) Text
Here’s how it will look when done:
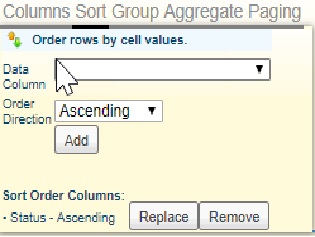
Sort on Status Ascending
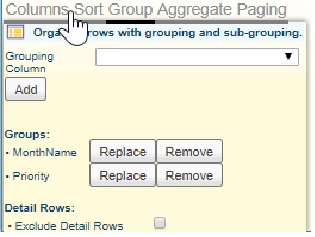
Group on Priority and MonthName
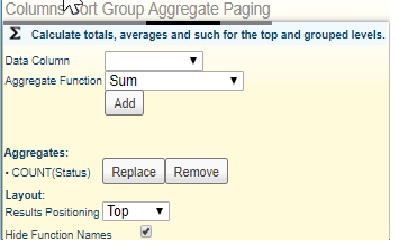
Aggregate with COUNT(Status). Set the Layout to Results Positioning of Top and select the box for Hide Function Names
This is how the report will look after this is done:

SORT CATEGORY BY MOST USED SOLUTION
This report is created using only the Category and Incident number fields in the Configuration section. One filter is used. The data used in this example does not use a specific time period, however, a time period could be used by following the process in “Data for the previous month” or in an Advanced Search.
Within the Table settings, deselect the Incident Number and select the Incident check box. The Incident check box is a simple counter field and will always contain the value “1”.

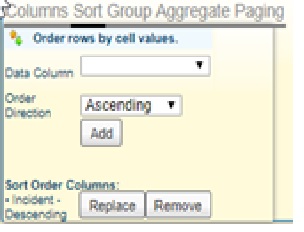
Click on Sort in the table settings and select Incident as the data column as ascending.
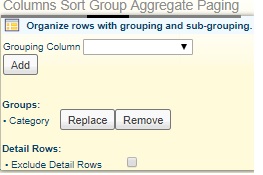
Click on Group in the table settings and select Category.
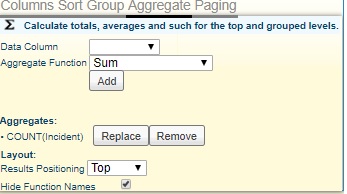
Click on Aggregate in the table settings and select Incident as the Data Column with the Count Aggregate Function. Select the Layout with Results Positioning as Top an check the Hide Function Names check box.
This is how the report will look after this is done:

