I had a customer who wanted a report that would show how long it took to close tickets by hours and days. For this, I used Buckets in reporting, which I had never used before, and I thought I’d share!
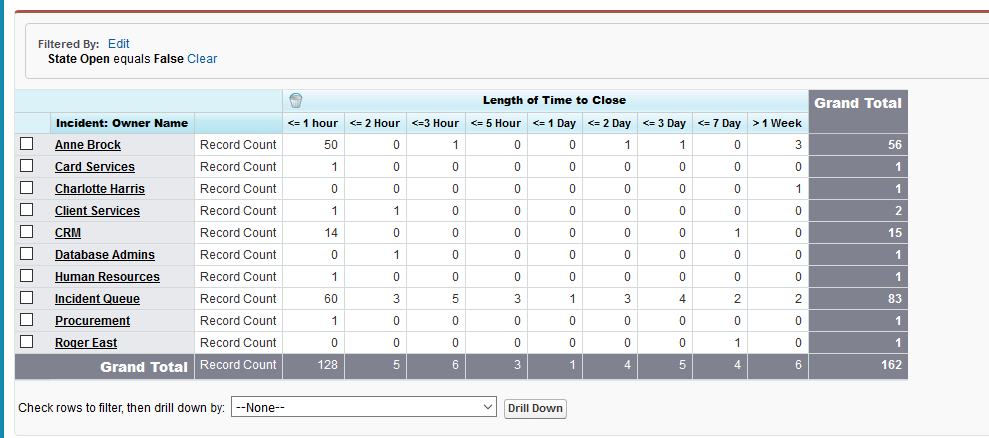
First – here is the end result – isn’t it pretty?
 How did I get it?
First Step: a custom field; a formula field. I used 3 decimal places; formula is “BMCServiceDesk__closeDateTime__c – BMCServiceDesk__openDateTime__c”.
\
 Then I created a new report against Incident. I added two fields to the report: “Owner Name” (you may want to use “Staff” instead) and the new field I had just created (AB Time Open). I then added a filter of “State Open = False”. I set the report to matrix; and put the Owner Name as the left-hand column. Next I went to the “Show” menu and unchecked the Details option:
\
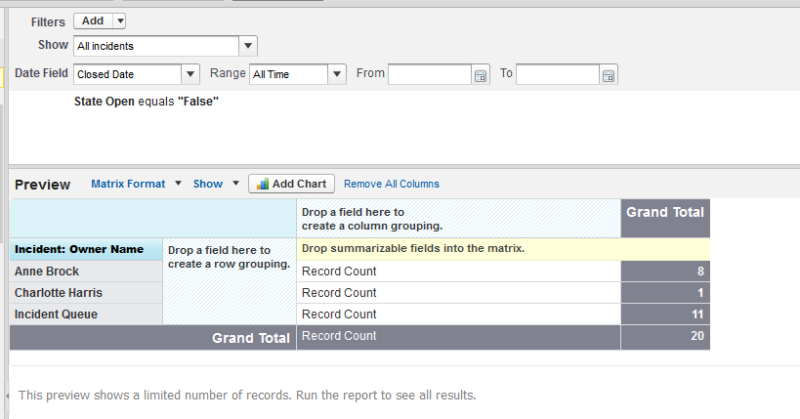
 This gives me this report so far:
 \
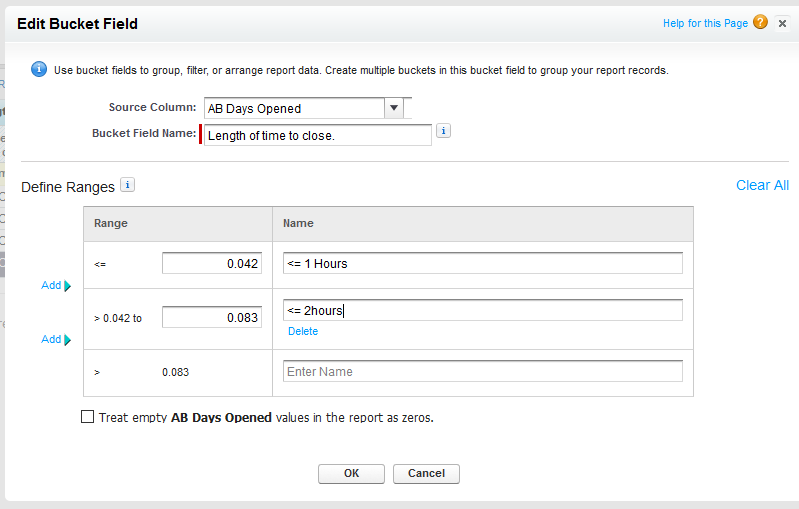
And now, the magic – I dragged “Add a Bucket Field” from the left over to the “Drop a field here to create a column grouping”. I named it, and started filling it out. Key thing here is that field that you created. If a ticket was open for 1 hour, and the field is set to three decimal places, you will have 0.042 in the new field. (1 hour divided by 24 is 0.04166666667). That means all tickets where the new field is less than 0.042 were open less than an hour. Between 1 and 2 hours, the field will be between 0.042 and 0.083. (Some of you may want to use more decimal places.)
So, while editing the bucket field – choose your new field as the source column. You will then get the opportunity to “Define Ranges”. This is how it looks as you start:
 \
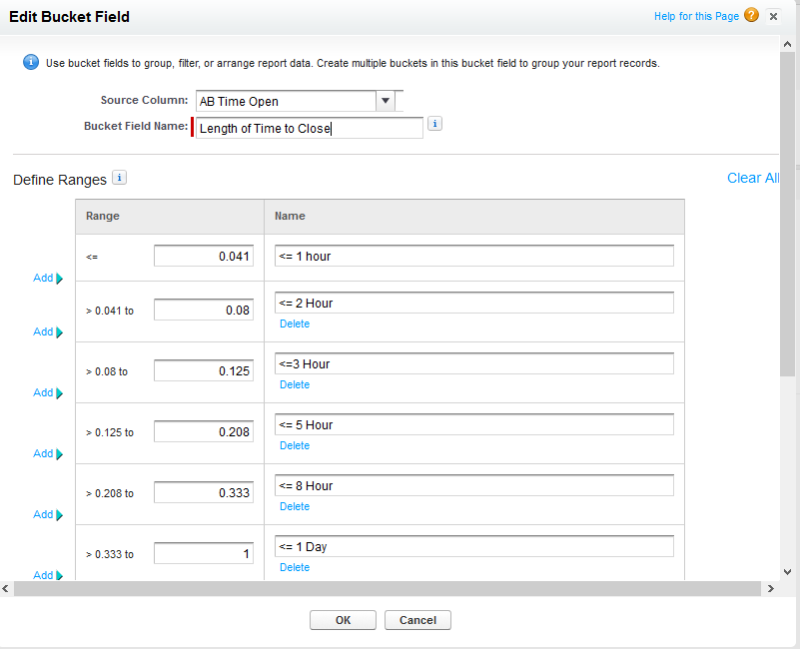
And now as you build it out further:
 In my report, I did buckets for <= 1 hour, <= 2 hours, <= 3 hours, <= 5 hours, <= 1 day, < =2 days, <= 3 days, <= 7 days and then > 1 week. That’s what my customer wanted; your buckets may vary.
Save your bucket field, and that’s all it takes to get the kind of report we saw at the beginning of this article.
Hope this helps with a report you’ve been wanting to have!
 How did I get it?
First Step: a custom field; a formula field. I used 3 decimal places; formula is “BMCServiceDesk__closeDateTime__c – BMCServiceDesk__openDateTime__c”.
\
 Then I created a new report against Incident. I added two fields to the report: “Owner Name” (you may want to use “Staff” instead) and the new field I had just created (AB Time Open). I then added a filter of “State Open = False”. I set the report to matrix; and put the Owner Name as the left-hand column. Next I went to the “Show” menu and unchecked the Details option:
\
 This gives me this report so far:
 \
And now, the magic – I dragged “Add a Bucket Field” from the left over to the “Drop a field here to create a column grouping”. I named it, and started filling it out. Key thing here is that field that you created. If a ticket was open for 1 hour, and the field is set to three decimal places, you will have 0.042 in the new field. (1 hour divided by 24 is 0.04166666667). That means all tickets where the new field is less than 0.042 were open less than an hour. Between 1 and 2 hours, the field will be between 0.042 and 0.083. (Some of you may want to use more decimal places.)
So, while editing the bucket field – choose your new field as the source column. You will then get the opportunity to “Define Ranges”. This is how it looks as you start:
 \
And now as you build it out further:
 In my report, I did buckets for <= 1 hour, <= 2 hours, <= 3 hours, <= 5 hours, <= 1 day, < =2 days, <= 3 days, <= 7 days and then > 1 week. That’s what my customer wanted; your buckets may vary.
Save your bucket field, and that’s all it takes to get the kind of report we saw at the beginning of this article.
Hope this helps with a report you’ve been wanting to have!